Market Insights & Tools
Get access to charting guides, indicators, trading platforms, and analysis tools that professionals use — explained in simple, actionable language.
Get access to charting guides, indicators, trading platforms, and analysis tools that professionals use — explained in simple, actionable language.
Fundamental analysis is a method used to understand why a market moves. Instead of focusing on charts, it looks at economic, financial, and real-world factors that influence an asset’s value over time.
In Forex and crypto trading, fundamental analysis involves studying things like interest rates, inflation, economic data, and consumer behaviour of a country. It also considers news and global events, such as political developments or natural disasters, that can affect market confidence and currency demand.
Traders use fundamental analysis to identify key events or “catalysts” that may cause a sharp price movement. These events can strengthen an existing trend or trigger a reversal or breakout in the market.
In simple terms, fundamental analysis helps traders understand what drives price changes, not just how prices move.

Fundamental analysis is a method used to understand why a market moves. Instead of focusing on charts, it looks at economic, financial, and real-world factors that influence an asset’s value over time.
In Forex and crypto trading, fundamental analysis involves studying things like interest rates, inflation, economic data, and consumer behaviour of a country. It also considers news and global events, such as political developments or natural disasters, that can affect market confidence and currency demand.
Traders use fundamental analysis to identify key events or “catalysts” that may cause a sharp price movement. These events can strengthen an existing trend or trigger a reversal or breakout in the market.
In simple terms, fundamental analysis helps traders understand what drives price changes, not just how prices move.
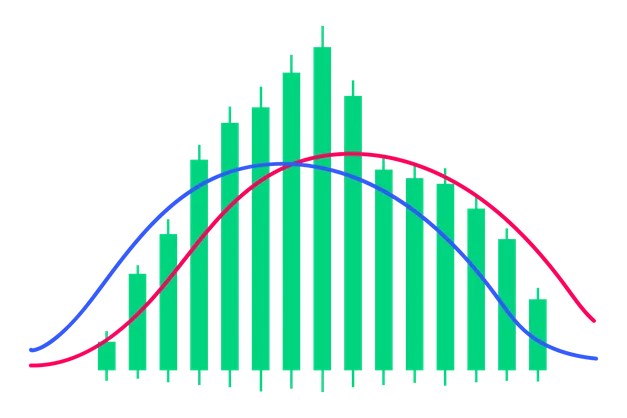
Indicators and oscillators are tools used in technical analysis to help traders understand price direction, momentum, and market conditions. They are created using mathematical calculations based on price, volume, or time and are displayed directly on trading charts.
Indicators usually help identify trends and market direction. They show whether a market is moving up, down, or sideways.
Oscillators move within a fixed range and help identify overbought or oversold conditions, which can signal possible reversals.